Operational Statistics and Adverse Events
The Operational Statistics and Adverse Events section is similar in
its organization as the
CPU Utility.
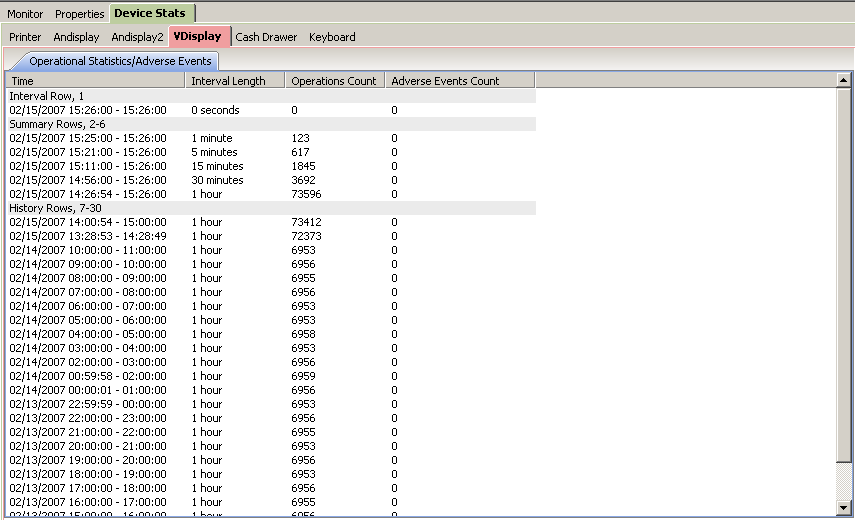
Operational Statistics and Adverse Events are shown for each
device. The example below shows statistics for the VDisplay. The
Interval Row, 1, shows the counts for the last x seconds. Summary
Rows, 2-6, show varying intervals. History Rows, 7-30, show
one-hour intervals for 24 hours.